Reliability Modelling
As data centres scale up to be potentially gigawatt-scale operations powering AI, cloud, and mission-critical services, reliable and resilient electrical distribution remains essential. Power drives both IT equipment and cooling systems, directly impacting performance. But how can this reliability be measured simply to compare different design options?
A RAM (Reliability, Availability, and Maintainability) study helps quantify system reliability by analysing component failure modes and their impact on downtime. Combining physics, statistics, and engineering, RAM estimates the probability of a system performing its intended function over time. RAM Modeling reveals:
- What combinations of failure/events are likely to occur
- How important individual failure modes/events are (to the overall system health)
- System sensitivity to changes in component reliability or failure events
‘Failure modes’ refer to equipment malfunctions, while ‘events’ include scenarios like maintenance, human error, or external factors. Accurate RAM analysis requires a multidisciplinary approach, consulting experts and manufacturers on topology, operations, and reliability data. Simulating all operational and maintenance modes provides a complete risk profile.
RAM modelling offers actionable insights early in design process (RIBA stages 2–3), that can lead to cost-effective changes and boosting resilience. There are a significant amount of acronyms and definitions in reliability analysis. The most pertinent are listed in the following table.
|
Parameter
|
Definition
|
|
Unavailability
|
Probability of a system not operating at any given time.
|
|
MTTR
|
Mean time to repair: time to restore a failed system to health. MTTD (Mean Time To Diagnose) may be included in MTTR.
|
|
MTTF
|
Mean time to failure: time from the beginning of operation (t=0) to the next failure. This does not count MTTR periods. The inverse of MTTF is Failure Rate.
|
|
MTBF
|
Mean time before failure: time from a failure to the next, including MTTR period.
|
|
Failure Frequency
|
No of failures per unit of time, accounting for MTTR.
|
|
Unreliability
|
The probability that the system has failed ≥1 times from t=0 to t=t, given that it was operating at t=0
|
Table 1. – Main RAM acronyms and their definitions.
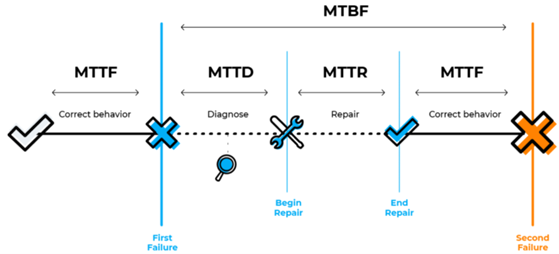
Understanding the failure characteristics in Table 1 is essential for accurately defining a RAM model. Fig. 1 illustrates how different RAM parameters relate to one another.
Figure 1. - "MTT-" variants (source: Central Engineering Data Centre Training).
RAM model parameterisation
The RAM study process can be outlined in sequential stages, but in practice, the model and data evolve iteratively, with accuracy improving as the project progresses. Next table outlines the full process from forming functional block diagrams to generating results.
|
Stage
|
Description
|
|
1
|
SLD/FBD
|
Convert complex SLDs (Single Line Diagram) to FBDs (Functional Block Diagrams) showing only major operational components. This process may include simplification of process assumptions to reduce model complexity.
|
|
2
|
FMEA
|
Failure Modes & Effects Analysis: Document what failure modes are applicable, and their effects on system health.
|
|
3
|
Modelling
|
Construct the failure model. This can be an FT (Fault Tree & analytical), or RBD (Reliability Block Diagram & numerical). It should take into account simplifying assumptions, and all considered failure modes and system components.
|
|
4
|
Failure Data Gathering
|
Gather MTBF/MTTR etc. values. Failure data must come ideally be project-specific and supplied by the manufacturer. Alternatives are trusted generic sources such as the IEEE Gold Book.
|
|
5
|
Results
|
Run simulations and interpret the results, ensuring good understanding of the available analyses and their implications. Identify and correct unrealistic outcomes by tracing errors to their source. This demands strong communication between design engineers and RAM analysts throughout the project to prevent costly mistakes from reaching final stages of design.
|
Table 2. - Stages of RAM modelling. Note that “failure data” here refers to parameters such as unavailability, MTBF, MTTR, etc. For a non-failure downtime event such as maintenance, the MTBF could refer to the maintenance interval.
Failure data figures feed into a probability distribution (“failure model”) of which there are many types. For instance different distributions exists that capture changing failure rates with age, latent failure, etc. These require more specific and convoluted input data. Often manufacturers are able to provide a simplified and fleet-wide availability, or an overall MTTR/MTBF figure. With a simplified approach, engineering judgement is required to determine the best fit distribution.
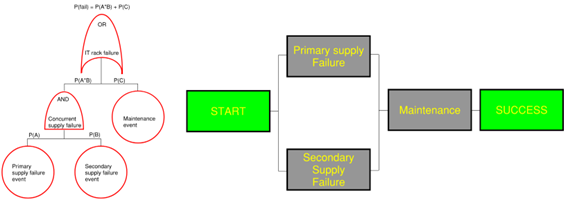
RAM Software tools usually offer a drop-down list to assign a failure model type, and change the required input parameters accordingly. Fault Trees and Reliability Block Diagrams are used to model power and hydronic systems. The following figure is an example of how diagrams can be used to illustrate failure events:
Figure 2. Left: Example Fault Tree (FT). Right: Reliability Block Diagram (RBD) for event paths that can lead to an IT rack being down.
The fault tree (FT) operates in a “failure” space. This means the top event (system failure) looks at the paths beneath it and considers the likelihood that a failure (or a combination of failures) can propagate up the tree where the final logic gate needs to report the probability of system failure. On the other hand, the Reliability Block Diagram (RBD) operates in a “success” space. This means that the diagram flow begins at the start, and consider if a satisfactory output (healthy system) can be reached. A healthy system is one where no failures would block the RBD paths.
Considerations & results
The accuracy of a RAM study is limited to the quality of the input data and the complexity of the model. Previously, cooling systems were modelled separately from power systems for simplicity and clarity. However, as technology evolves, these systems have become more integrated with increased interfaces. For example, direct to chip liquid cooling connects electrical and mechanical components intimately to improve the chip’s cooling.
Therefore, an in-depth understanding of the system being modelled and close consultation with project stakeholders is essential. Some of the key questions to consider are outlined below.
|
Question
|
Considerations & likely sources of Information
|
|
How does the system work?
|
SLDs, schedules, datasheets, Consultation with system designers.
|
|
What are the failure modes?
|
To include maintenance (and some plant may have >1 failure modes). Consult OEMs[1] and the design team.
|
|
What assumptions can be made?
|
E.g. if switchgears can be modelled as a single entity, vs. as individual cabinet, breakers, etc. Consult the design team.
|
|
What are the performance requirements?
|
Desired model results. Usually 5 9’s (99.999%) availability at the input to the IT racks. This can be sourced from design brief documents.
|
|
What is the minimum failure data required?
|
MTTR/MTBF/Unavailability of equipment (or more?). What probability distribution (e.g., rate, Weibull…) should be used? Is the information accurate?
|
|
Footnote:
[1] Original Equipment Manufacturer.
|
Table 3. - Key questions for RAM modellers to ask.
When based on accurate data, RAM simulation results are very interesting, offering interesting insights and informed decisions on system weaknesses and how to improve them. For example, the quantities of redundant equipment to specify, the redundancy topology, system reinforcement, spares, maintenance regime, etc. can all be optimised on the basis of insights from a high-fidelity RAM model. A RAM study is an excellent quantitative tool that summarises system reliability and allows comparative analysis of multiple topologies.
Additionally a RAM analysis can assist in fulfilling certification requirements and industry standards set by organisations such as the Uptime Institute, as well as minimising costly operational risks.